decorative
DANCING  Logo linking to Home Page
Three part image of dancers with disabilities performaing on stage

Infographics

On this page, you will find infographics relating to the research activities of the DANCING project.  All infographics have been designed by Norbert Croonenberg Accessibility Design with ideas and text by Prof. Delia Ferri, Principal Investigator of DANCING.


Home » Resources » Infographics

Infographic: Between Disability and Culture: The Search for a Taxonomy of Sign Languages in the European Union

Link to accessible version of infographic entitled 'Between Disability and Culture:  The Search for a Taxonomy of Sign Languages in the European Union'.

Published 26th September 2024.

Infographic: Between Disability and Culture: the Search for a Taxonomy of Sign Languages in the European Union.

Infographic: Flowchart of ‘Lived Fiction’

Link to accessible version of infographic entitled 'Flowchart of 'Lived Fiction'.

Published 4th March 2024.

Infographic: Flowchart of 'Lived Fiction'.

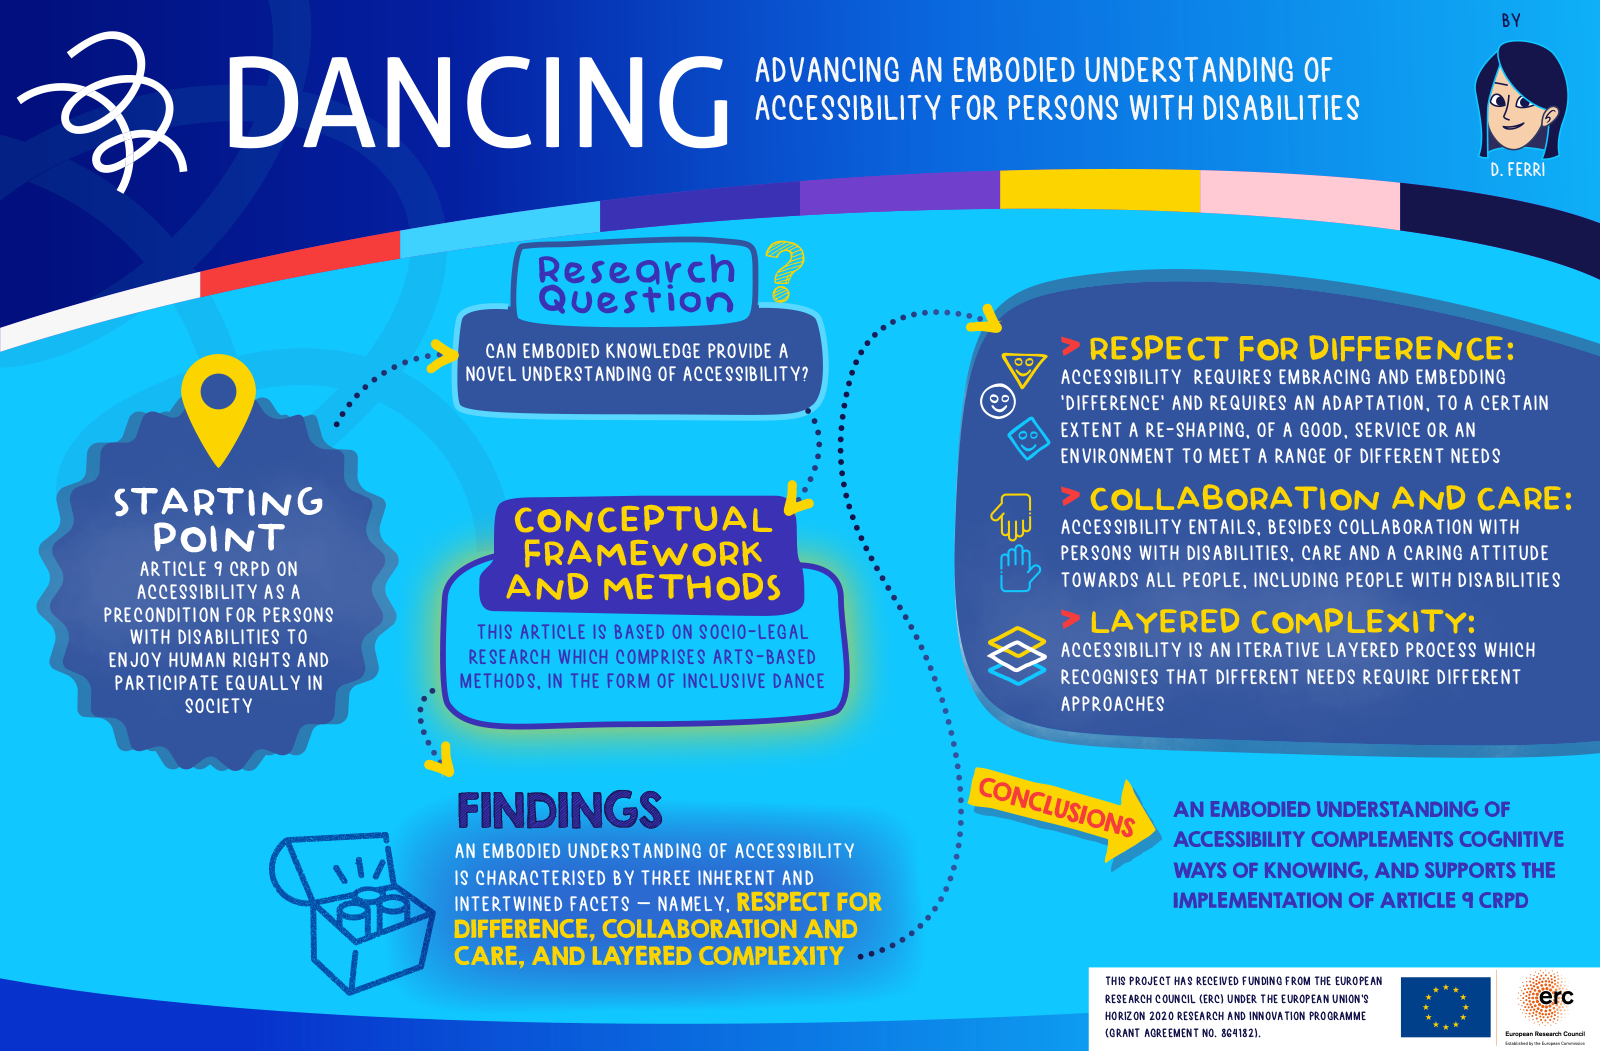
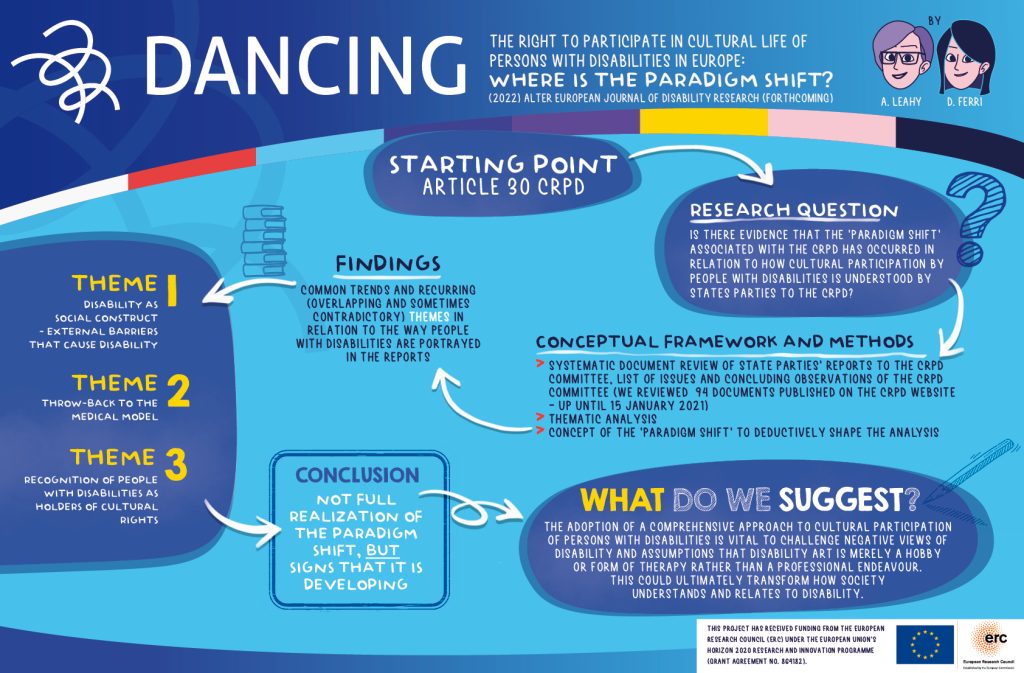
Infographic: Where is the Paradigm Shift?

Link to accessible version of infographic entitled 'Where is the Paradigm Shift?'

Published 21st March 2022 for Social Justice Week.

Infographic: Where is the Paradigm Shift?

GIF: Aim of DANCING Project

Link to accessible version of 'Aim of DANCING Project GIF'.

Published 16 October 2021.

DANCING GIF to showcase the aims of the project – reducing barriers to inclusion in the Arts.

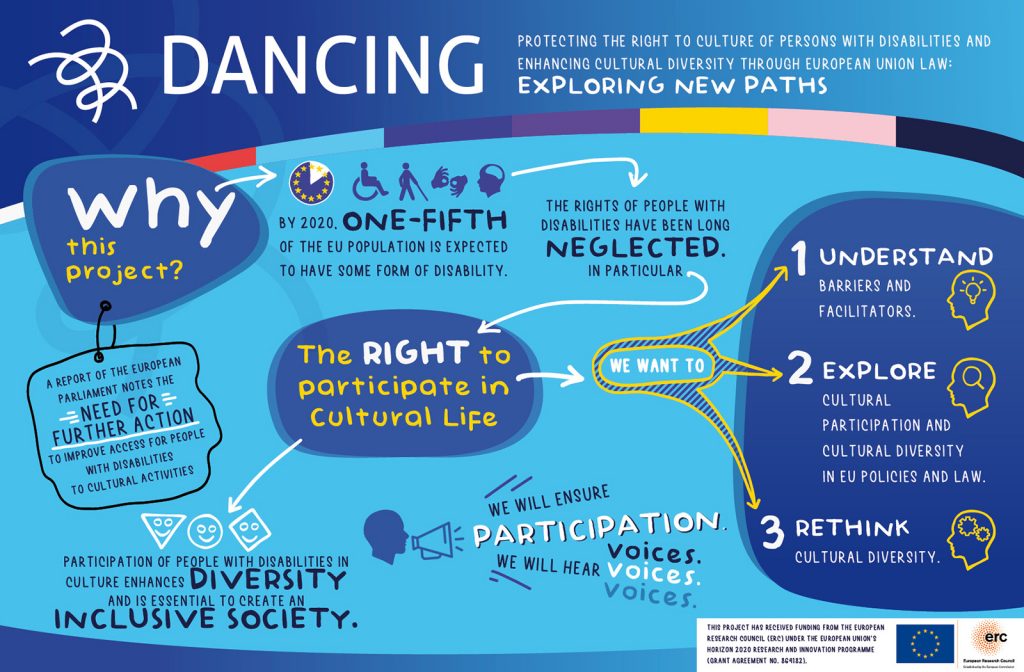
Infographic: Why this Project?

Link to accessible version of infographic entitled 'Why this Project?'

Published 29th January 2021.

Infographic:  Why this Project?

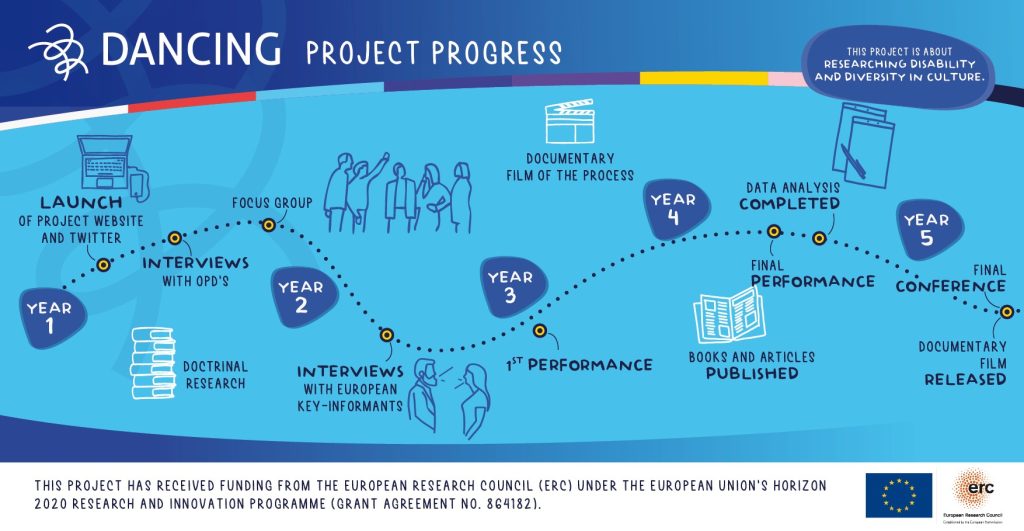
Infographic: Project Progress

Link to accessible version of infographic entitled 'Project Progress'.

Published 12th December 2020.

Infographic:  Project Progress.

Skip to content